If you’ve ever tried to fill a night shift ICU opening in the last two years, you already know the numbers aren’t just academic. Healthcare workforce projections show the U.S. will need roughly 200,000 new registered nurses every year through 2032, and that’s before you count the shortfall in respiratory therapy, surgical tech, and allied health roles. Whether you’re a facility administrator staring at an open-shift dashboard or a clinician deciding where to plant your next contract, understanding healthcare staffing industry trends isn’t optional anymore. It’s the difference between planning ahead and scrambling every quarter.
This guide walks through what’s actually driving the numbers, how the major roles compare, where pay and demand are heading, and what you can do with that information right now. No jargon, no fluff. Just the data and what it means for you.
Why Healthcare Workforce Projections Matter Right Now
The Bureau of Labor Statistics and HRSA (Health Resources and Services Administration) both publish long-range staffing forecasts, and they don’t always agree on magnitude, but they agree on direction: demand is outpacing supply in nearly every clinical category.
Three forces are driving this:
- An aging population. By 2030, every Baby Boomer will be 65 or older, and older adults use roughly three times more healthcare services than younger adults.
- An aging workforce. Around 1 in 5 RNs is over age 55, and a wave of retirements is already thinning out experienced staff in med-surg and ICU units.
- Burnout-driven attrition. A 2023 NCSBN survey found nearly 100,000 RNs left the profession during the pandemic, and another 800,000 reported intent to leave by 2027.
None of this is speculative. It’s showing up in vacancy rates today. Hospitals in rural markets are feeling it hardest, with some reporting RN vacancy rates above 15%, compared to 9-10% in urban systems.
What “Projections” Actually Measure
A workforce projection isn’t a guess dressed up in a spreadsheet. It combines current employment data, expected retirements, school enrollment and graduation rates, and population health needs to model supply against demand over a set period, usually 5 to 10 years out. HRSA’s models, for instance, separate projections by state and specialty, which is why a national nursing shortage headline can mask a surplus in one metro and a crisis in another.
Healthcare Staffing Industry Trends by Role
Not every role is short-staffed the same way. Here’s how demand breaks down across the roles facilities are struggling to fill.
| Role | Projected Growth (2022-2032) | Median Pay (2024) | Biggest Pressure Point |
|---|---|---|---|
| Registered Nurses | +6% (194,500 openings/yr) | $86,070/yr | Retirements + burnout attrition |
| Nurse Practitioners | +45% | $126,260/yr | Fastest-growing occupation in the country |
| Home Health Aides | +21% | $33,530/yr | Low pay driving high turnover |
| Respiratory Therapists | +13% | $77,960/yr | Aging patient population, COVID aftereffects |
| Medical & Lab Technologists | +5% | $60,780/yr | Diagnostic testing demand outpacing new grads |
Source figures reflect BLS Occupational Outlook Handbook data. The catch? These are national medians. A travel RN contract in a high-need market like rural Texas or parts of California can run 30-40% above the listed median, while saturated metro markets sit flat or even dip.
How staffdna.com Helps With Healthcare Workforce Projections and Healthcare Staffing Industry Trends
Reading a projection report is one thing. Acting on it, fast, is another. That’s where staffdna.com fits in.
- Real-time job market data, not lagging annual reports, so you can see which specialties and states are actually hiring this week, not last year.
- Direct facility-to-clinician matching that cuts out layers of middlemen markup, which matters when projections show pay compressing in oversaturated regions.
- Credentialing and licensure tracking built into your profile, so when a high-demand contract opens in a new state, you’re not losing two weeks to paperwork.
- Transparent pay data across contracts, so you can compare a projected regional shortage against what facilities are actually offering, not just what a projection model estimates.
If you’re a clinician trying to time your next move around where demand is real, or a facility trying to staff ahead of a projected gap instead of behind it, staffdna.com gives you the current picture instead of a stale one. Create a free profile at staffdna.com and see what’s actually open in your specialty right now.
Regional Variation: Why National Numbers Can Mislead You
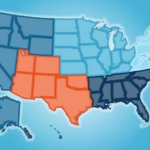
Here’s the thing most headlines skip. A national projection showing a 6% RN growth rate tells you almost nothing about whether your local hospital will be fully staffed. Mississippi, Georgia, and South Dakota are projected to face RN shortfalls exceeding 10% of their workforce by 2030, according to HRSA state-level modeling. Meanwhile, states like New York and Massachusetts are projected to have surpluses in some specialties because of nursing school output outpacing local retirements.
This is exactly why healthcare staffing industry trends need to be read at the state and even metro level, not just nationally. If you’re a traveler chasing the best combination of pay and demand, the state-level breakdown is the number that matters, not the national one.
What Facilities Should Do With This Data
Projections are only useful if they change a decision. Here’s what that looks like in practice:
- Build a 12-18 month staffing runway, not a reactive one. If your state’s projection shows a widening RN gap starting in 2027, start locking in float pool and travel contracts before the crunch, not during it.
- Diversify your staffing mix. Facilities relying solely on permanent hires are more exposed to projection swings than those blending permanent staff with a flexible travel and per diem bench.
- Track burnout indicators internally, since national attrition projections are built from surveys, not your specific unit. Your own exit interview data is often a better early warning system than a five-year federal model.
Facilities that treat projections as a planning input, updated quarterly against real hiring data, consistently outperform those that check the numbers once a year and file the report away.
Frequently Asked Questions
What are healthcare workforce projections and why do they matter?
Healthcare workforce projections are data-driven forecasts, usually from the BLS or HRSA, estimating future supply and demand for clinical roles based on retirements, population growth, and school enrollment. They matter because they help facilities plan hiring 1-5 years ahead instead of reacting to shortages after they hit.
Which healthcare roles have the biggest projected shortages?
Registered nurses and nurse practitioners top the list in raw numbers, with NPs projected to grow 45% through 2032, the fastest of any healthcare occupation tracked by the BLS. Respiratory therapists and home health aides also show significant projected gaps.
How accurate are healthcare staffing industry trends reports?
They’re directionally reliable but not precise at the local level. National projections can miss regional swings, so it’s worth cross-checking state-level HRSA data or current job market activity on a platform like staffdna.com against the broader national forecast.
Will the nursing shortage get better or worse by 2030?
Most models point to it getting worse before it improves, largely because retirements are outpacing new graduate output in several states. Some regions with strong nursing school pipelines, like parts of the Northeast, are expected to stabilize sooner than the national average.
How can I use workforce projections to plan my travel healthcare career?
Look at state-level demand data alongside current open contracts and pay rates, not just national averages, since a national shortage doesn’t guarantee strong pay in every metro. Checking real-time listings against the projection data gives you a much clearer picture than the forecast alone.
Conclusion
Key Takeaways:
- Healthcare workforce projections point to a widening gap in RNs, NPs, and allied health roles through 2032, driven by retirements and burnout, not just population growth.
- National numbers hide regional reality. State-level data is what actually matters if you’re hiring or job-hunting.
- Healthcare staffing industry trends shift fast enough that quarterly reviews beat annual ones, for facilities and clinicians alike.
Projections tell you where the puck is going. Acting on them, whether that’s locking in staffing contracts early or timing your next travel assignment, is what actually pays off. If you want to see current demand instead of a five-year estimate, check open roles and real pay data at staffdna.com today.